
NSE at BSE: The celebrity tenant and its modest rent cheque
NSE’s high-profile listing brings visibility and additional trading revenue to BSE. But the fees are modest. The real engine of BSE’s revenue remains its own derivatives business.
Dr V Shunmugam
- Nov 2, 2026,
- Updated Nov 2, 2026 5:58 PM IST
Every shopping mall manager understands the appeal of a celebrity tenant. When a well-known brand moves in, visitor numbers rise and the mall gains recognition. Yet when the manager reviews the month-end accounts, the largest rent cheque often comes from another tenant.
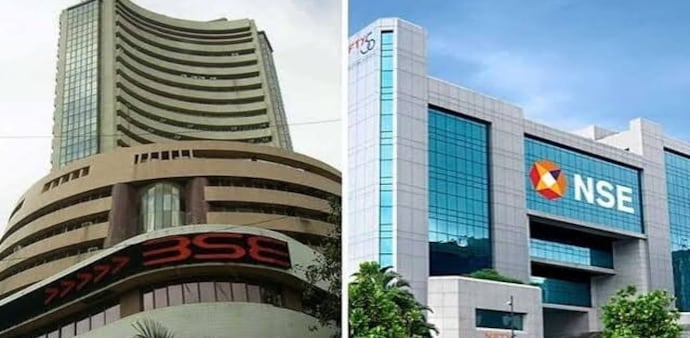
The listing of the National Stock Exchange (NSE) on BSE, formerly the Bombay Stock Exchange, invites a similar comparison. The symbolism is striking: India’s largest stock exchange is now a publicly traded company on the platform of its oldest rival. Television tickers track every movement in its share price, making it easy to assume that BSE is collecting substantial rent from its prominent tenant. The financial records, however, tell a more understated story. To understand it, we must follow the fees rather than the headlines.
Advertisement
Think of BSE as a shopping centre that charges a modest fee on each transaction conducted on its premises. When investors buy and sell NSE shares on BSE, the money exchanged belongs to the buyers and sellers. BSE retains only its transaction charges. NSE’s market capitalisation, initial public offering (IPO) size and daily trading value may be substantial, but they are not BSE’s revenue. Nor does hosting NSE shares give BSE a share of NSE’s own exchange earnings. The tenant and the landlord run separate businesses.
How substantial are those fees?
The accompanying chart tracks BSE’s earnings from trading in NSE shares over 15 sessions, from October 8 to 29, 2026. It shows:
- Total earnings of ₹28.71 lakh over the 15 sessions
- An average of about ₹1.91 lakh per session
- Daily earnings ranging from ₹0.94 lakh on October 19 to ₹3.21 lakh on October 27
- About ₹4.8 crore a year, if the daily average holds for 250 sessions
- A share of about 2.5% of BSE’s cash market revenue, which was around ₹11.5 crore for the same period.
A 2.5% share may seem respectable, but the denominator matters: cash trading is only one part of BSE’s business. The annualised figure of ₹4.8 crore is illustrative, not a forecast. The table below puts it alongside BSE’s standalone figures for 2025–26:
Advertisement
Sources: the accompanying chart and BSE’s annual report for 2025–26. BSE figures are standalone. The annualised estimate for trading in NSE shares assumes 250 trading sessions at the observed daily average.
BSE’s real anchor tenant is its own derivatives business. In 2025–26, equity derivatives generated approximately 12.5 times as much revenue as cash trading. BSE’s annual report identifies Sensex contracts as a significant driver of this activity.
A simple calculation illustrates the difference in scale. A 1% change in derivatives revenue amounts to approximately ₹31.3 crore—more than six times the annualised fees generated by trading in NSE shares. This is a comparison of scale, not a prediction. It nevertheless highlights the main driver of BSE’s earnings: even a modest shift in derivatives participation, liquidity or pricing carries substantially more weight than trading in any single high-profile stock.
Advertisement
Three distinctions help clarify the debate. First, exclusivity and scale are different things. As the listing venue, BSE collects fees on trades executed on its platform. The size of those receipts still depends on trading volumes and the charges applied.
Second, visibility deserves its own measure. A famous listing can raise an exchange’s profile and draw investor attention. Whether it also brings wider business is a separate question, one that requires evidence of fresh activity and revenue.
Third, listing fees and trading fees are separate receipts. Initial and annual listing charges, issue-related services and secondary-market transaction charges must each be counted separately. The chart covers trading alone. NSE’s full contribution across these categories therefore remains to be measured, though it may not materially change the overall picture.
The exclusivity story also comes with a footnote. Reports indicate that NSE shares have been available on the Metropolitan Stock Exchange of India (MSEI) under its “permitted to trade” category since September 24, 2026. An exclusive listing is one thing; exclusive trading access is another.
None of this diminishes NSE’s value as a tenant. Trading in its shares brings BSE additional business, particularly valuable when existing infrastructure can accommodate it at minimal extra cost. But transaction revenue is not profit, and the figures so far point to a useful contribution rather than a transformative one.
Advertisement
The figures themselves warrant caution. The chart’s daily bars total ₹28.74 lakh, slightly above its headline figure of ₹28.71 lakh because of a minor rounding discrepancy. The turnover and fee calculations have not been independently verified. Annualising results from just 15 sessions also assumes that the observed level of interest will persist. Yet the chart shows how quickly activity can change, with daily earnings fluctuating nearly threefold over three weeks. These caveats support a measured assessment: at the observed pace, trading in NSE shares makes a modest contribution to BSE’s accounts.
The more consequential questions lie elsewhere. Can BSE deepen liquidity, continue to attract traders to its derivatives products and turn that activity into sustainable earnings? A high-profile listing may capture attention for a day; a marketplace must earn its place in every trading session.
NSE may be the most prominent tenant in BSE’s building, but BSE’s revenue still rests on the marketplace it has built around its own products.
Dr V. Shunmugam is a financial markets specialist with 27 years of experience in India’s securities and commodity markets. He is a Partner at MCQube, a Mumbai-based securities markets and infrastructure consulting firm, and has served as Chief Economist and Head of Research and Index Administration at two of the stock exchanges.
Advertisement
Views are personal
Every shopping mall manager understands the appeal of a celebrity tenant. When a well-known brand moves in, visitor numbers rise and the mall gains recognition. Yet when the manager reviews the month-end accounts, the largest rent cheque often comes from another tenant.
The listing of the National Stock Exchange (NSE) on BSE, formerly the Bombay Stock Exchange, invites a similar comparison. The symbolism is striking: India’s largest stock exchange is now a publicly traded company on the platform of its oldest rival. Television tickers track every movement in its share price, making it easy to assume that BSE is collecting substantial rent from its prominent tenant. The financial records, however, tell a more understated story. To understand it, we must follow the fees rather than the headlines.
Advertisement
Think of BSE as a shopping centre that charges a modest fee on each transaction conducted on its premises. When investors buy and sell NSE shares on BSE, the money exchanged belongs to the buyers and sellers. BSE retains only its transaction charges. NSE’s market capitalisation, initial public offering (IPO) size and daily trading value may be substantial, but they are not BSE’s revenue. Nor does hosting NSE shares give BSE a share of NSE’s own exchange earnings. The tenant and the landlord run separate businesses.
How substantial are those fees?
The accompanying chart tracks BSE’s earnings from trading in NSE shares over 15 sessions, from October 8 to 29, 2026. It shows:
- Total earnings of ₹28.71 lakh over the 15 sessions
- An average of about ₹1.91 lakh per session
- Daily earnings ranging from ₹0.94 lakh on October 19 to ₹3.21 lakh on October 27
- About ₹4.8 crore a year, if the daily average holds for 250 sessions
- A share of about 2.5% of BSE’s cash market revenue, which was around ₹11.5 crore for the same period.
A 2.5% share may seem respectable, but the denominator matters: cash trading is only one part of BSE’s business. The annualised figure of ₹4.8 crore is illustrative, not a forecast. The table below puts it alongside BSE’s standalone figures for 2025–26:
Advertisement
Sources: the accompanying chart and BSE’s annual report for 2025–26. BSE figures are standalone. The annualised estimate for trading in NSE shares assumes 250 trading sessions at the observed daily average.
BSE’s real anchor tenant is its own derivatives business. In 2025–26, equity derivatives generated approximately 12.5 times as much revenue as cash trading. BSE’s annual report identifies Sensex contracts as a significant driver of this activity.
A simple calculation illustrates the difference in scale. A 1% change in derivatives revenue amounts to approximately ₹31.3 crore—more than six times the annualised fees generated by trading in NSE shares. This is a comparison of scale, not a prediction. It nevertheless highlights the main driver of BSE’s earnings: even a modest shift in derivatives participation, liquidity or pricing carries substantially more weight than trading in any single high-profile stock.
Advertisement
Three distinctions help clarify the debate. First, exclusivity and scale are different things. As the listing venue, BSE collects fees on trades executed on its platform. The size of those receipts still depends on trading volumes and the charges applied.
Second, visibility deserves its own measure. A famous listing can raise an exchange’s profile and draw investor attention. Whether it also brings wider business is a separate question, one that requires evidence of fresh activity and revenue.
Third, listing fees and trading fees are separate receipts. Initial and annual listing charges, issue-related services and secondary-market transaction charges must each be counted separately. The chart covers trading alone. NSE’s full contribution across these categories therefore remains to be measured, though it may not materially change the overall picture.
The exclusivity story also comes with a footnote. Reports indicate that NSE shares have been available on the Metropolitan Stock Exchange of India (MSEI) under its “permitted to trade” category since September 24, 2026. An exclusive listing is one thing; exclusive trading access is another.
None of this diminishes NSE’s value as a tenant. Trading in its shares brings BSE additional business, particularly valuable when existing infrastructure can accommodate it at minimal extra cost. But transaction revenue is not profit, and the figures so far point to a useful contribution rather than a transformative one.
Advertisement
The figures themselves warrant caution. The chart’s daily bars total ₹28.74 lakh, slightly above its headline figure of ₹28.71 lakh because of a minor rounding discrepancy. The turnover and fee calculations have not been independently verified. Annualising results from just 15 sessions also assumes that the observed level of interest will persist. Yet the chart shows how quickly activity can change, with daily earnings fluctuating nearly threefold over three weeks. These caveats support a measured assessment: at the observed pace, trading in NSE shares makes a modest contribution to BSE’s accounts.
The more consequential questions lie elsewhere. Can BSE deepen liquidity, continue to attract traders to its derivatives products and turn that activity into sustainable earnings? A high-profile listing may capture attention for a day; a marketplace must earn its place in every trading session.
NSE may be the most prominent tenant in BSE’s building, but BSE’s revenue still rests on the marketplace it has built around its own products.
Dr V. Shunmugam is a financial markets specialist with 27 years of experience in India’s securities and commodity markets. He is a Partner at MCQube, a Mumbai-based securities markets and infrastructure consulting firm, and has served as Chief Economist and Head of Research and Index Administration at two of the stock exchanges.
Advertisement
Views are personal
Read more!