












This may seem like an odd observation—states like Gujarat, Maharashtra, or Tamil Nadu, in terms of the contribution of manufacturing to state GDP, are clearly ahead of the other, more ‘agricultural’ states. Even their more basic indicators like per capita income are much higher.
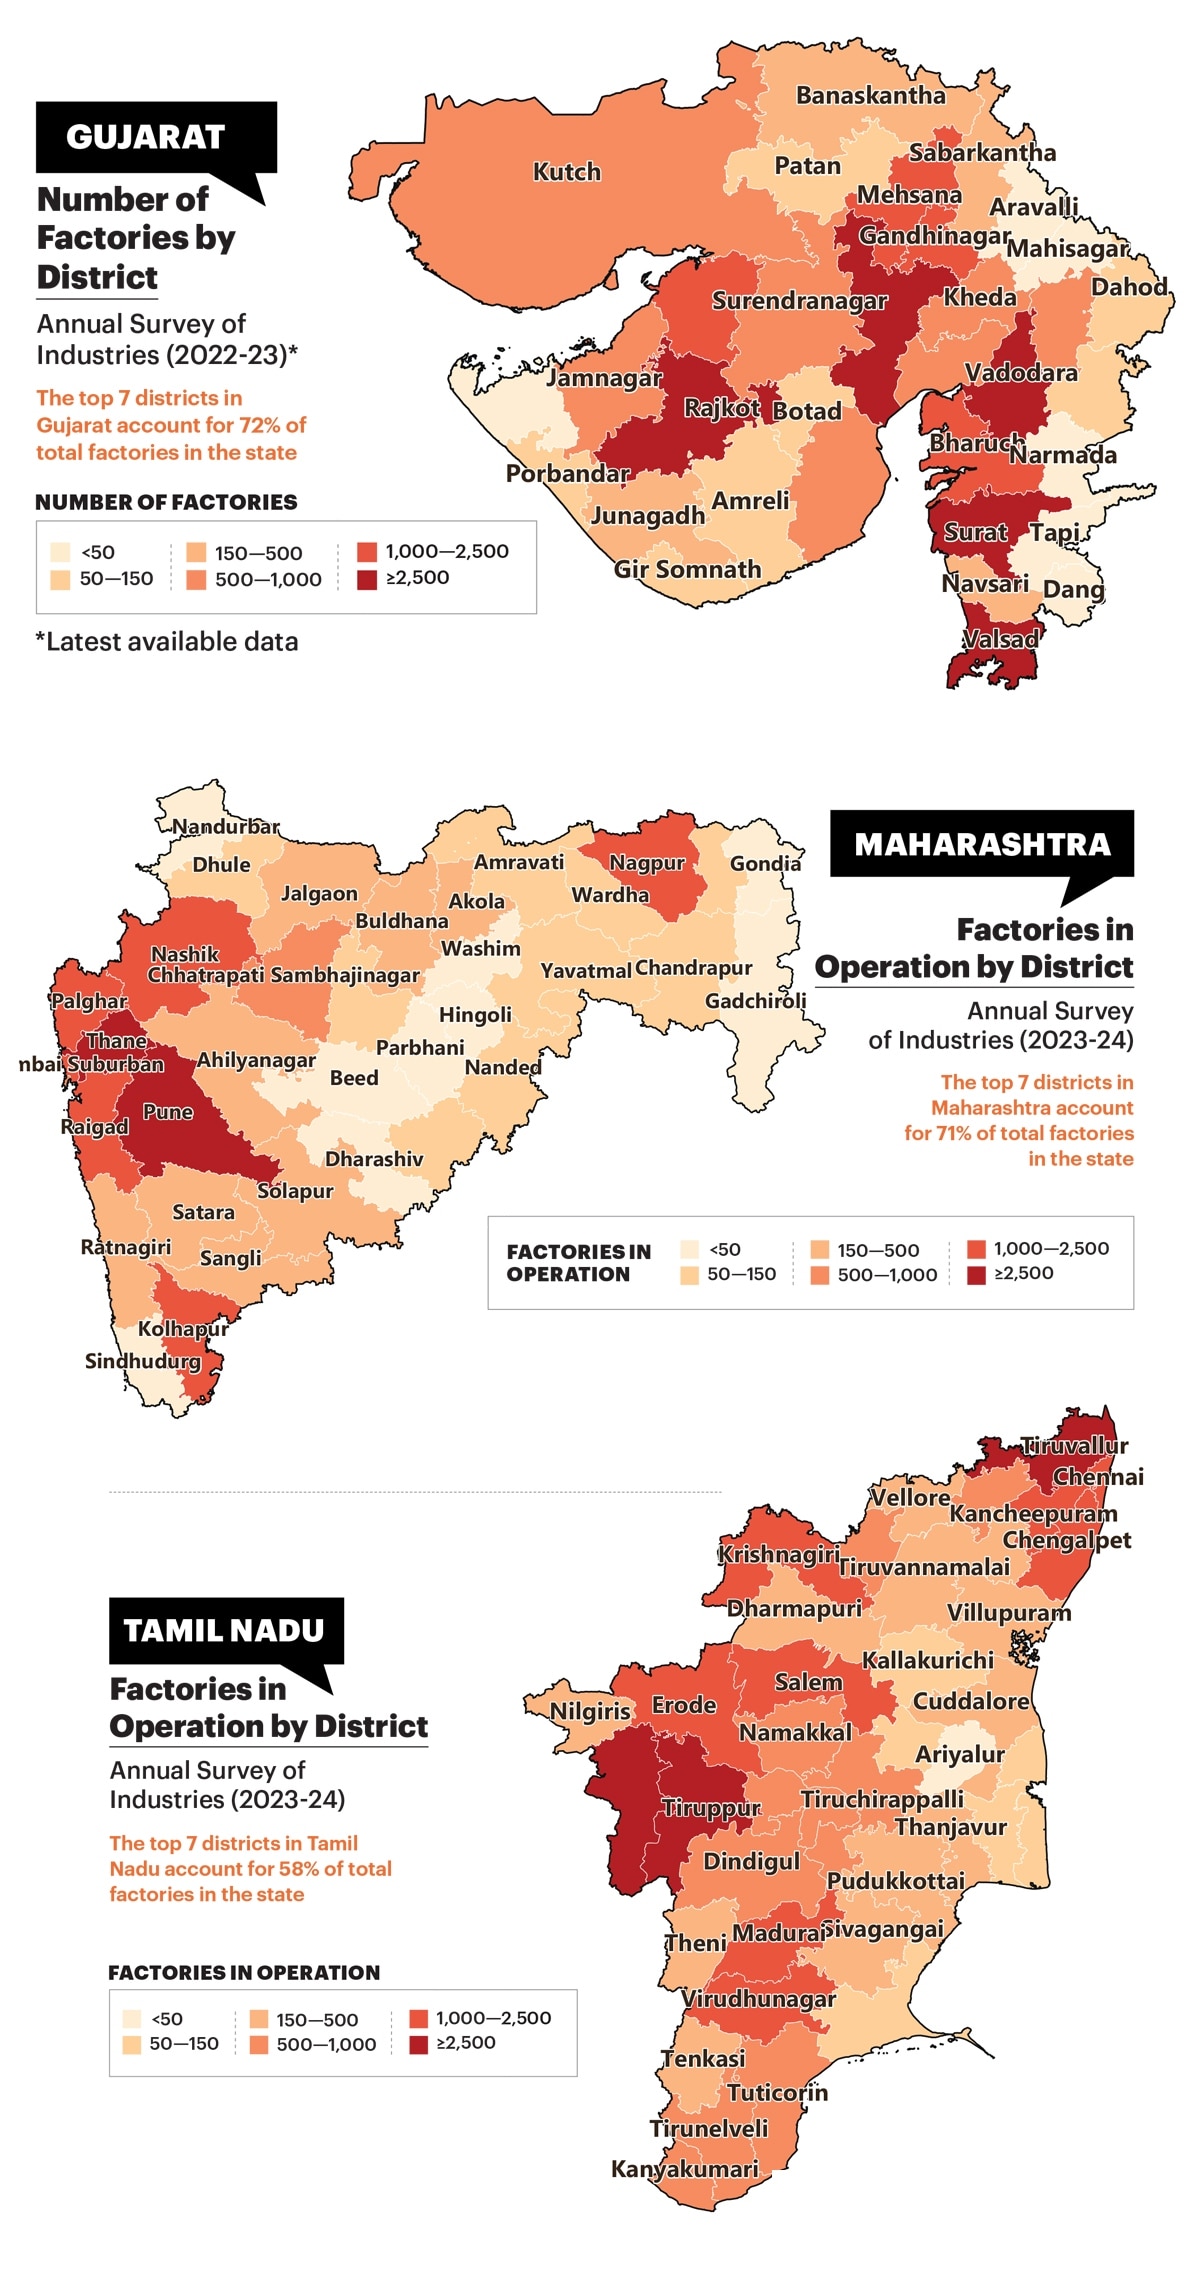
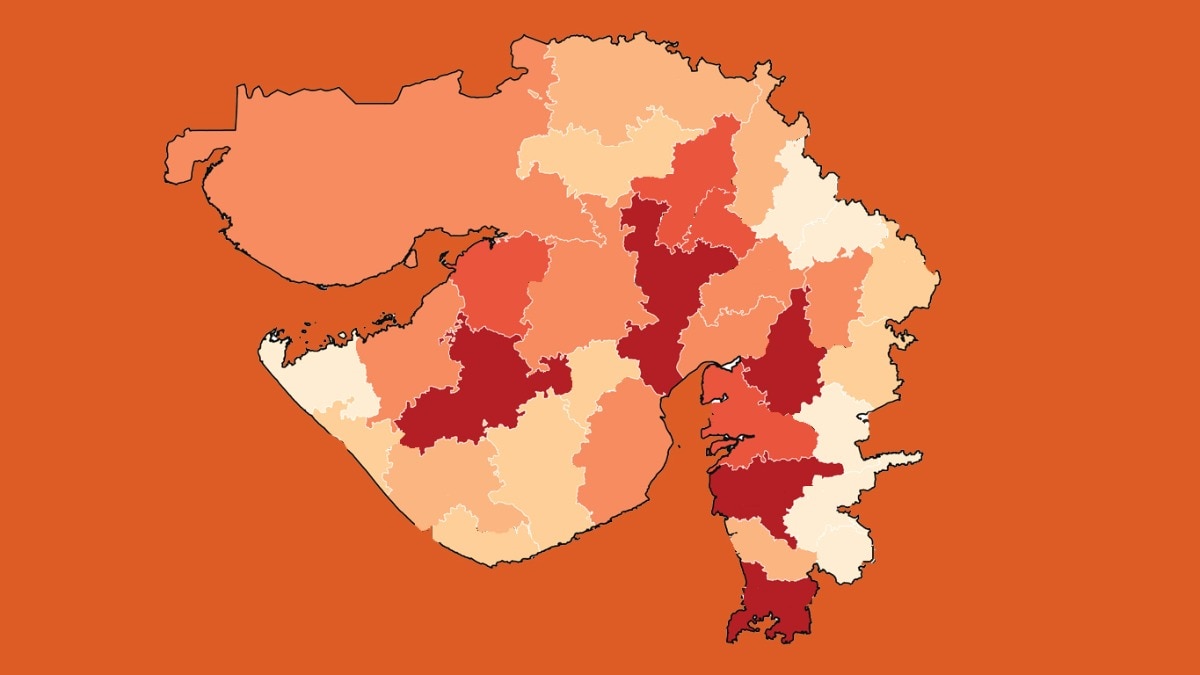
But a state-level number like manufacturing GDP conceals dramatic intra-state inequalities. Take Gujarat. The state contains 4,059 factories belonging to the BSE 1000 index manufacturing companies. But the Top Seven districts, out of 33 districts in the state, accounted for over half the total factories in the state.
Widen the perspective a bit, and the inequality becomes even worse than this. According to the state government’s Annual Survey of Industries (ASI) report, which is broader in scope than the BSE 1000 and covers the entire set of factories in the state, big and small, the picture is even more dramatic (data is for 2022-23, the last date for which the report was published). Using this broader set of data, the top seven districts account for close to 72% of total factories in the state.
Districts like the tribal district of Dangs, in Gujarat, have no factories whatsoever. The top seven districts account for over 81% of net value added in the state by manufacturing.
The ASI data at the district level is published by individual state governments and only a few publish it regularly. So here, we highlight data for only three relatively more industrialised states.
For Maharashtra, the figures for the ASI’s total factories in operation, and net value added are virtually similar to Gujarat’s—71% and 80% respectively for top seven districts out of a total of 36, as of 2023-24.
Tamil Nadu is only slightly more equitable. The top seven districts (out of a total of 38 districts) account for 58% of factories in operation and 77% of net value added, as of 2023-24.


