
Kerala's capital is fast emerging as an important knowledge city of south India and is rated high among tier II cities for its improved infrastructure.
 |
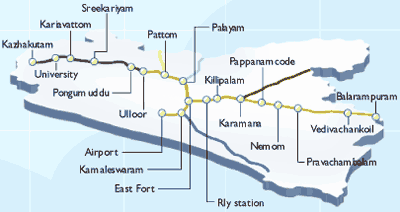
| Enlarged map |
Price Propellers
Some upcoming projects that could influence real estate prices in future
1. Technopark
With the creation of additional 2 lakh sq ft space in Phase 2 and a Technocity on a 500 acre campus, the number of companies is likely to go up to 110 and working professionals to 30,000
2. Transport Infrastructure
Inner and outer ring roads and new international terminal at the airport will significantly improve connectivity within and to the city
3. SEZs
Manufacturing is gaining prominence with improved investment opportunities and projects like KINFRA Apparel Park, Film and Video Park and Automobile Park
Integrated Mass Transport Project
The project, to be executed under Jawaharlal Nehru National Urban Renewal Mission, will create a 52-km network of roads by combining 7 major traffic corridors
New Residential Projects Builder Project Location Price (Rs)* Oceanus Dwellings Serenity Kulathoor 28 lakh Relcon Properties Relcon Residency Pattom 35 lakh Artech Group Samrudhi Lakeview Akkulam 35 lakh Skyline Foundations Carlton Ambalamukku 36 lakh Condor Builders Marigold Vazhuthacaud 51 lakh Nikunjam Const. Fortune Kowdiar 53 lakh *Average price of a 3-bedroom apartment
The residential real estate is fast emerging from being end-user driven to investment driven.That has pushed up prices significantly
Retail Space Distribution by 2008 MG Road 45% Kazhakutam-Kovalam Bypass 20% Pattom 15% Vashutacaud 10% Akkulam 10% Total retail space supply by 2008: 2 million sq ft
Scarcity of land along MG Road, the central business district of the city, has led to developments in suburbs like Kazhakutam
Buying Options
| Area | Cheap | Price | Expensive | Price |
| Central | Pattom | 2200 | Kowdiar | 3000 |
| North | Kazhakutam | 1400 | Ulloor | 2000 |
| East | Thirumala | 1800 | Kesavadasapuram | 2400 |
| South | Thiruvallom | 1500 | Vizhinjam | 1900 |
| Prices of residential properties in Rs/sq ft | ||||
Price Change
Average percentage price change in 2006 and 2007 (expected)
| Region | 2006 | 2007 |
| North | 30% | 25% |
| East | 20% | 10% |
| South | 25% | 15% |
| Central | 30% | 15% |


