
Children are often put to bed and threatened that the “wicked witch” will come for them in order to make them behave. Investors are often threatened with “volatility” in the same meaningless way. In truth, volatility can be a good friend for an investor and help earn higher returns. You see, volatility consists of large movements — either up or down. If the trend is in your favour you want high volatility because that means higher returns.
But the downside is that when the trend is against you, volatility hurts. However, there are sound mathematical reasons to believe that the upside in volatility is more than the downside. Indeed, historically stock markets generate higher returns than other, less volatile assets.
The danger comes from psychological factors. In uptrends, investors get reckless and assume that the trend will always be up. For example, this happened during the technology stock boom of the late 1990s and between 2004 and 2005 when the markets were only going one way — up.
In such situations, many investors invest aggressively, get high returns, continue to invest aggressively and hope it remains that way forever. They panic when it doesn’t. However, you can seek volatility to generate higher returns provided you keep your eyes open and wear a parachute. One way is to create a relatively concentrated portfolio to beat the market through an injection of volatility.
A given stock may have performance that wildly varies from the market. A few carefully chosen stocks may also deliver a consolidated return that varies a lot. A widely diversified portfolio will give a return that is close to the average. If you buy every stock in an index, you will naturally get a performance that almost mirrors the index.
There is an optimum asset-allocation range where a portfolio offers good chances of beating the market without massive downside risks. Once you have such a portfolio, you have to grit your teeth and hold on when the trend is against you. If you panic and sell on every downside, you are sure to go bankrupt.
There are ways to judge how volatile given stocks or an overall portfolio will be. The movement of a stock (or the consolidated movement of a portfolio) can be compared to the movement of an index in various ways.
To explain how this works, we took the example of a dummy portfolio that comprised random 10 stocks selected from the two portfolios in our special section over the past five years.
We used the BSE 500 as our base index. Only one — Bajaj Auto — of the portfolio’s 20 constituents returned below the average benchmark BSE 500 return of 2.95% per month for the five-year time frame. The main tool used to calculate stock volatility is called beta. The beta of an investment compares it to the index movement as a relative measure of risk.
A positive beta means that the stock and the index have moved in the same direction. A beta of 1 for instance means that the stock has moved exactly 1% for 1% move in the index. A beta of minus 1 means that it has moved exactly that amount in the opposite direction.
A beta of less than 1 means that it is less volatile than the market while a beta greater than 1 means that it is more volatile. A beta of +0.50 for instance, would indicate that on an average, the investment’s returns move half as much as the markets do in the same direction. High-beta stocks are the ones most sensitive to market volatility.
All beta values for the dummy portfolio were positive, indicating strongly the portfolio’s movement is in sync with the market trend. Values ranged between 0.6 and 1.8. For six scrips the beta was greater than 1; meaning moves in the same direction as the market but of greater amplitude. So if the market trend is good, the dummy portfolio will offer higher returns than the market.
Another measure of risk is statistical variance. We can calculate the average of a set of numbers — in this case of price change. Then we compare each number in the set to the average to see how widely changes are dispersed. This is done by subtracting the average from each numbers, squaring to eliminate negatives and then computing the average of the squares (the square root of the variance is standard deviation).
A high variance indicates changes are more widely dispersed and therefore, less predictable. This is so with our combined portfolio. For instance, when we compare variance of a stock such as Areva T&D to the BSE 500’s variance, Areva T&D has a relative variance of 17.39, which means that over the last five years, the stock has been 17.39 times riskier than the BSE 500.
Yet another useful tool is regression or r-squared (R^2) — this shows how close our predictions have been to actual historical values. We can use the beta value (this is an average) and back-calculate to see how different the actual movements were from the expected movements. This uses a technique known as R^2 or “leastsquares”. A high R^2 value means that the beta offers a very close fit between reality and prediction. High-beta, high R^2 (read as R-squared) stocks tend to be tricky.
As beta measures the responsiveness of a stock to moves in the broader market, R^2 measures degree to which the market’s movements seem to account for the movement. For instance, a highbeta and high R^2 stock is SAIL, which over the last five years has been a classic turnaround and hence, while following market fortunes has done extremely well for itself.
So, what does this all mean in terms of our portfolio? It’s more volatile, it’s more risky and it offers high correlation to market returns with a lot of predictability. If you believe as we do, that the stock market will gain in the long term, our portfolio will beat the market. It does carry a higher risk on the downside — mainly because of the aggressive nature of the stocks in the portfolio. So long as you understand this you can moderate the risk through overall asset allocation while gaining from the upside.
Benefiting from volatility
Here’s a simple explanation of how volatility can work in an investor’s favour to generate higher portfolio returns. Prices in financial markets can change in logarithmic fashion, doubling or falling 50% in three or more sessions.
At the extremes a price decline is limited to a 100% fall, but it can rise by an unlimited amount. Due to this unequal condition, statistically, the probability of movement up, (X%) is equal to probability of movement down [1 - 1/(1 + X/100)] x 100%. That is, the chance that there will be a down move is equally likely but the magnitude of down movement will usually be a little less than the upward movement. Over time, this translates into a slight upwards bias, which is positive for investors.
Now, if we buy two equally-priced stocks and one rises by a certain amount while the other falls by the expected amount in percentage terms, we end up with the following two-stock portfolio returns:
Applying the formula and averaging returns:
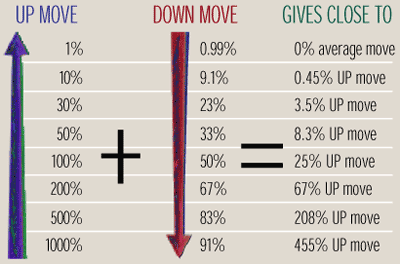 The table shows the gap between likely gains and losses increases as the magnitude of movement increases. Therefore, contrary to popular belief we can claim volatility is an investor’s friend.
Your returns are likely to be better with two volatile stocks where one rises 100% and the other falls 50%, producing an average return of 25%; than with two less volatile stocks, where one rises 10% and the other falls 9.1% and your net gain is a measly 0.45%.
Holding volatile stocks may work well. In the long run, changes in initial price increase and those increases work in your favour. Mathematically, a 100% return could be generated over several months or years; it makes no difference to the gap between given upmove and expected downmove.
This favours long-term investors. If you can exploit the fact that over time, the volatility will work in the portfolio’s favour. So, there is every reason to pick a portfolio of volatile stocks.
— Narayan Krishnamurthy


