
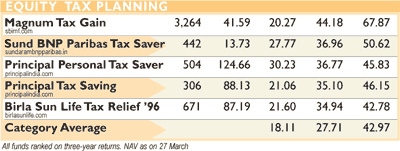
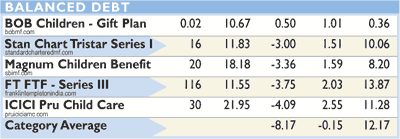
Three of the 10 funds across the two categories— equity diversified (first table) and equity tax plans (second table)—are from SBI. On three-year returns tax planning schemes do about as well as equity diversified. That makes them doubly attractive— given the added advantage of tax savings the schemes have.

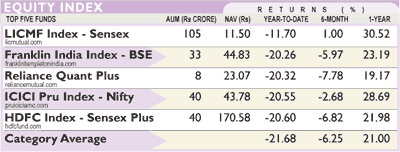
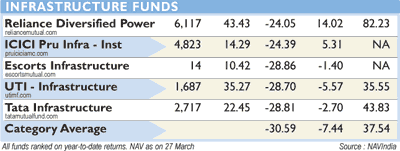
Volatility is mirrored in the index fund category (third table), with all funds in the red since the beginning of this year. Infrastructure funds (fourth table) as a theme has caught on, but they are yet to reflect in their performance; the nature of long gestation of such schemes calls for patience and perseverance.
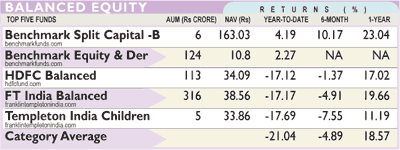
As a category, debt-oriented balanced funds (sixth table) lost less than a third of what the equity-oriented balanced funds (fifth table) have lost since the beginning of this year. But equityoriented balanced funds have done better than index funds as a category.
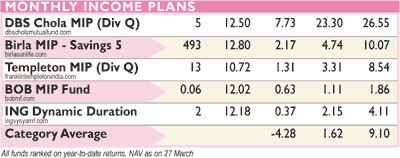
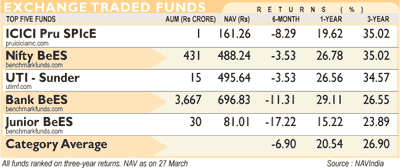
Monthly Income Plans (seventh table) as a category are going out of favour. Those seeking better returns from fixed deposits can opt out of these schemes considering the similar kind of return they have managed. Bank ETF (eighth table) as a category seems to be the most preferred, considering the AUM it has, but overall the category has had a mixed fortune.
SIP advantage demonstrated | |||
| Month | NAV (Rs) | Total Units Accumulated | Value (Rs) |
| Mar ’05 | 11 | 181.8 | 2000 |
| Jun ’06 | 15.75 | 881.1 | 13,877.3 |
| Dec ’06 | 14.1 | 1667.0 | 23,504.7 |
| Nov ’07 | 14.9 | 3260.0 | 48,574.0 |
| Feb ’08 | 17.35 | 4613.3 | 80,040.8 |
• An SIP of Rs 2,000 over a three-year tenure (Rs 72,000) from March 2005 to February 2008 would have grown to Rs 80,040.8—a growth of 11.17%
Purchasing Power | |||
| The table shows you how over time inflation reduces purchasing power | |||
| Years | Nominal value (Rs) | Purchasing Power (Rs) | Loss due to inflation (%) |
| 1 | 11,000 | 10,426.5 | -5.21 |
| 2 | 12,100 | 10,871.3 | -10.15 |
| 3 | 13,310 | 11,335.0 | -14.84 |
| 4 | 14,641 | 11,818.5 | -19.28 |
| 5 | 16,105 | 12,322.6 | -23.49 |
• Investment returns should be considered keeping inflation in mind
• At 10% nominal interest rate Rs 10,000 at no inflation will become Rs 16,105 in 5 years
• But with a constant 5.5% inflation through these 5 years; the purchasing power of this sum will reduce to Rs 12,322, or a 23% loss


