
The best performing tax plan, Magnum Tax Gain (second table) has an AUM much higher than what the best performing equity diversified funds manage (first table). As a category both fund types have performed almost alike in the past one year, though tax plans have the added benefit of tax deduction and follow lower risk approach.


One-year returns from index funds (third table) are lower than returns from equity diversified funds.And this is how index funds are supposed to work— less risky and less rewarding.The true worth of these funds will be when they show lower losses than equity diversified in times of downturn.


Going by the category average equityoriented balanced funds (fifth table) lost almost thrice of what the debt-oriented balanced funds (sixth table) lost in the past six months. But balanced-debt funds are for short-term investment.Though riskier, balanced-equity has earned doubly more than balanceddebt over a threeyear period.


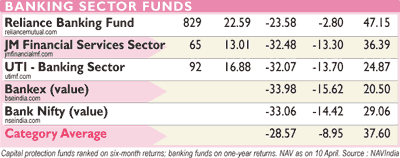
Capital protection funds (seventh table) are to assure no capital erosion; this concept works better when the market are going up. Except Kotak Wealth Builder, rest are in the red.The performance of banking funds (last table) prove the riskiness of sector funds.Though the category has earned 37% in the past one year, in the past three months it has lost 28% of it.

Portfolio churning Shares transacted by equity diversified funds during March 2008 | |||||
| What mutual funds bought... | ...and what they sold | ||||
| COMPANY | SHARES (Lakh) | EPS* | COMPANY | SHARES (Lakh) | EPS* |
| Ballarpur Industries | 77.71 | 13.5# | NTPC | 58.69 | 8.32 |
| Gujarat State Petronet | 74.93 | 1.65 | GVK Power & Infra | 54.88 | 6.28 |
| Action Const Equipments | 70.90 | 11.08 | Yes Bank | 33.03 | 6.76^ |
| EMCO | 63.93 | 39.76 | Exide Industries | 29.48 | 2.07 |
| Cairn India | 55.88 | -- | Hindalco Industries | 25.61 | 24.58 |
| *Annualised EPS for April 2006-March 2007. #Annualised EPS for July 2006-June 2007. ^Annualised EPS for April 2007-March 2008 | |||||
The takeaways
• With NTPC’s increased overheads hitting its bottom line (profits), the company is losing favour among fund houses
• The rise in newsprint prices is attracting fund houses to Ballarpur Industries


