
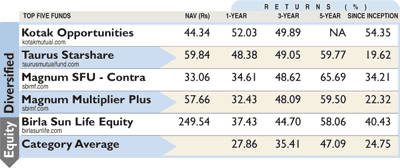
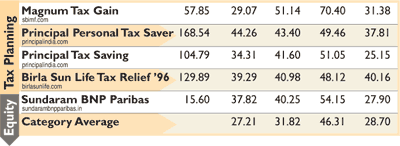
The returns from equity diversified (first table) and tax planning schemes (second table) prove that diversified mutual funds should be held for a minimum period of three years. SBI, as a fund house, has three funds in both categories. Magnum Taxgain has performed better than the best equity-diversified scheme over the past three years.
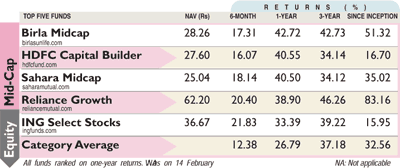
Index funds (third table) are not only less expensive, they have also fared well in the past three years, barring aberration in the short term, like current market swings. Midcaps (fourth table) have had a mixed fortune, but with renewed focus on mid-caps by fund houses, there may be some gems to pick in this space in the coming months.
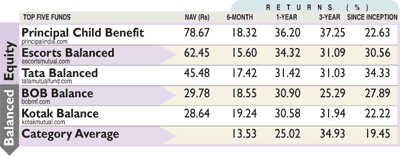
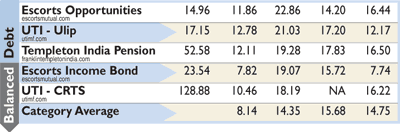
In the past one year equityoriented balanced funds (fifth table) have fared well, with some schemes matching the returns from equity-diversified and index funds. Balanced debt funds (sixth table) are yet to pick up; but are likely to show improvment now that interest rates are falling. It makes sense to hold.
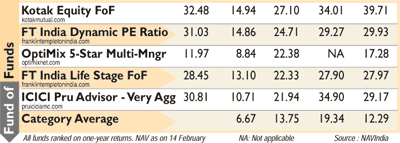
FoFs (eighth table) are driven by how their selected funds perform; their expertise is in picking good funds and fund managers rather than stocks. Franklin has done well, with two of its funds in the top five. ETFs (seventh table) as a category is catching up, but still has a long way to go in terms of choice available to investors.The returns too vary wildly with the Banking ETF outperforming the rest.
The SIP investor gains by averaging out the cost of purchase. In the table below, his average cost is Rs 17.90 even though in four out of six months the NAV was higher. The two SIPs during the downturn (April-May) were beneficial.
SIP advantage demonstrated | |||
| Month | NAV (Rs) | Total units accumulated | Value (Rs) |
| February | 18 | 111.11 | 2,000.00 |
| March | 20 | 211.11 | 4,222.22 |
| April | 17 | 328.75 | 5,588.88 |
| May | 16 | 453.75 | 7,260.13 |
| June | 18 | 564.86 | 10,167.65 |
| July | 19 | 670.13 | 12,732.52 |


