At over Rs 11,800 per 10 gm, you would think that gold is expensive. But analysts don’t think so. They feel that despite the phenomenal rise in the price of the yellow metal—from Rs 9,200 in January 2007 to Rs 11,819 per 10 gm on 1 February this year, a rise of 28%—there is still quite a lot of upside left. The weakening of the dollar and fears of a US slowdown have pushed up the price of gold in the global markets.
Back home, the instability in the stock markets and soaring demand are doing their bit to make the precious metal even more so. “Gold is seeing a run up in prices due to the current uncertainty in the global markets. Funds tend to move money into gold as it is considered a safe haven,” says Hiren Sanghvi, head, BRICS Commodities. Analysts believe that gold prices could move up 10-15% from these levels this year before stabilising.

Kotak Commodity too maintains its bullish stance on the metal. “Gold has generated a compounded growth of 14.41% in the past seven years. It would be safe to assume such returns in the coming years although we strongly believe gold will outperform,” said a spokesperson for the brokerage.
Some of these gains would be pared by the high entry and exit loads on investments in physical gold in the form of “making charges”. Even a plain gold coin does not escape a 5-10% deduction on that count. It’s here that gold exchange traded funds (GETFs) come as a better alternative for the investor.
GETF units can be traded on stock exchanges like any stock. While most GETF units are linked to the value of 1 gm of the metal, a new fund by Quantum AMC lowers the entry point by linking it to 0.5 gm. So should you invest in gold? Yes. But not because you are running away from stocks or mutual funds. As a near cash investment, gold will always have a place in your portfolio. It is time to review this part of your portfolio. And unless there is a specific consumption need, just opt for paper gold.
— Rajshree Kukreti and Tanvi Varma
Sensex movement | |
| Year 2004 | 43.6% |
| Year 2005 | 32.9% |
| Year 2006 | 54.7% |
| Year 2007 | 35.8% |
| Jan 2008 | -13% |
| Percentage annual change in Sensex; average for the year till 2007 and one-month average for 2008 | |
| Shining again | |
| Year 2008 | 12.6% |
| Year 2005 | 8.7% |
| Year 2006 | 35.9% |
| Year 2007 | 15.5% |
| Jan 2008 | 33% |
| Percentage change in gold price has been calculated on year-on-year basis except for 2008, where it shows a one-month change | |
Easier comparison
| Word’s worth |
 “The [economic] fundamentals are very strong.There’s no reason to allow the worries of the western world to overwhelm us” “The [economic] fundamentals are very strong.There’s no reason to allow the worries of the western world to overwhelm us” P Chidambaram, finance minister, on the stock market." |
“There is a lot of uncertainty in financial markets and gold is a good place to park money” T Gnanasekar, director at Commtrendz Research |
| After this correction, a lot of large-cap companies... offer more potential than the mid-cap and small-cap stocks” R Rajagopal, chief investment officer of DBS Cholamandalam Asset Management |
| “Real estate funds, allow investors to get exposure to the pan-India realty market” Kuldip Chawlla, director, PE fund Red Fort Capital, on why realty funds are less risky than buying local property |
| Source: Financial Express, Economic Times and Business Standard |
Making comparisons is only human, and we tend to compare everything, from people to products to prices. When it comes to comparing financial products, the process becomes time-consuming, and is often a tough challenge. But here, at last, is some good news for the scores of mutual fund investors who have struggled to compare funds beyond returns. The Association of Mutual Funds of India (Amfi) has now recommended a standard format for fact sheets to enable fair and easy comparison.
A fact sheet is a report that provides investors with details on how their investments have fared and what kind of holdings the mutual fund has had. For instance, Templeton Mutual Fund discloses key risk-return ratios and details scheme objectives with an explanation on how the fund has fared. Sundaram BNP Paribas Mutual Fund prefers to profile its fund managers in its fact sheet.
Amfi would like fund houses to disclose the names and experience of fund managers and expense ratios, plus basic details like scheme name, objective and type, and key financial ratios like Sharpe, standard deviation, beta, etc to facilitate better comparison. However, unless the market regulator Sebi steps in, this attempt may just -remain an idea.
- Narayan Krishnamurthy
Guarantee in times of volatility
Uncertainty in the stock markets has opened a window of opportunity for assured return schemes. After all, any guarantee is a confidence booster. But assured returns also mean lower returns, especially now that an across the board cut in interest rates is expected soon. This could be a big blow to risk-averse investors expecting high yet assured returns. So, while bank deposit rates are still hovering at around 9% for a one-year deposit, these may just start to move southwards soon.
Insurance companies are always for capital guarantee and are known to offer assured returns, however minimal, from time to time. In recent times, several life insurance companies have come up with assured returns or guarantees. ING Vysya Life Insurance, for one, has launched a Guaranteed Growth Plan, which offers a 5% guaranteed return on premiums invested with a potential for higher returns from investing in equity markets. Says Kshitij Jain, managing director and CEO, ING Vysya Life Insurance: “This product will meet the customer’s need of reaping the benefit of market-linked returns, without having to suffer the pitfall of its volatility.”
Tata-AIG’s InvestAssure Flexi has also come out with a guaranteed bonus on maturity to policyholders who stay insured for 10 years. Moreover, several Ulip funds offer a capital guarantee fund option, taking care of potential market volatility for risk-averse investors, who can still gain from market upturns. With more investors entering the markets, guaranteed return schemes may be just on their way back.
— Rakesh Rai
| NFO watch |
| Standard Chartered Small & Mid Cap Equity Fund NFO closing: 15 February |
| HSBC Emerging Markets Fund NFO closing: 15 February |
| Lotus India Mid and Small Cap Fund NFO closing: 19 February |
| HDFC Infrastructure NFO closing: 21 February |
| ICICI Prudential Fusion Fund Series - III NFO closing: 21 February |
| LIC Infrastructure Fund NFO closing: 4 March |
| Morgan Stanley ACE NFO closing: 10 March |
| JM Tax Gain Fund NFO closing: 25 March |
Pay less to invest in mutual funds
If you, as a retail investor, have long been complaining about having to bear the marketing cost of the fund you were invested in, while large corporate investors and high-networth individuals got away without paying a penny, hope is at hand.
According to the Securities and Exchange Board of India (Sebi), all mutual fund schemes should now meet the marketing and other expenses connected with sales and distribution of schemes from the entry load.
The entry load itself has been done away with for investors who invest in open-ended schemes directly, without an intermediary. Closed-ended funds did not charge an entry load, but deducted 6% as initial expenses to cover marketing and sales cost.
They will now have to scrap this 6% charge and meet expenses from the entry load, which has the upper limit of 2-2.5%—same as open-ended schemes. The move is expected to bring in more transparency with more accurate upfront disclosures to investors about the expenses charged in closedended schemes.
Permission to charge up to 6% as initial expenses to mobilise the fund had fuelled a flurry of closed-ended schemes. Such a steep charge encouraged fund houses to spend investor money on big budget promotional campaigns.
This expense was charged to the schemes, amortised over a period of three years and included in the NAV. Sebi’s move is expected to bring in more long-term mutual fund investors and facilitate less churning on mutual fund portfolios. But it will be some time before the real impact is seen on fund houses and investors.
What funds charge:
• Open-ended MF schemes charge 2-2.5% of the amount invested as entry load
• Closed-ended schemes charge up to 6% as initial expenses amortised over the tenure of the scheme
• Sebi plans to scrap entry load on close-ended schemes
-Rakesh Rai
Cash on SMS
| Telling figures |
| Some figures that have immediate or long-term personal finance implications |
| 3.19 crore is the number of taxpayers who filed returns in 2006-7, up 6.3% from 2005 |
| 47% is the rise in tax collection between 2006-7 and 2007-8 |
| 7.17 lakh tax returns were filed online in 2006-7 |
| 84.8 lakh is the number of PAN cards issued in 2007-8. This is 14% of total cards issued so far |
| AUM (Rs crore) | Sensex | ||
| DEC 2007 | 5,49,942 | 1 JAN | 20300 |
| JAN 2008 | 5,49,114 | 31 JAN | 17648 |
| % CHANGE | -0.15% | -13.06% | |
| Annual Premium | ||
| FOR COVER OF Rs 1 LAKH | FOR COVER OF Rs 4 LAKH | |
STANDARD | 1,095 | 4,200 |
EXCLUSIVE | NA | 4,800 |
PREMIUM | NA | 6,000 |
Random Nuggets of Wisdom
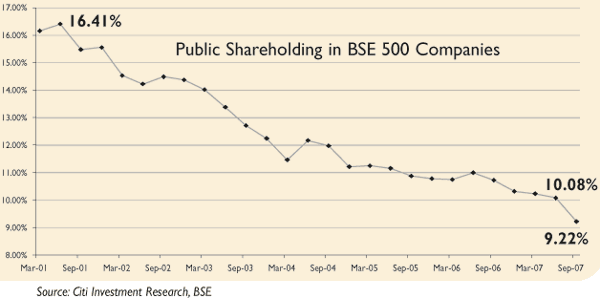
The five-year stock market frenzy has become bedroom conversation but the direct retail ownership in BSE 500 companies has dropped steadily. This, however, is offset by indirect holdings through mutual funds and insurance plans.