











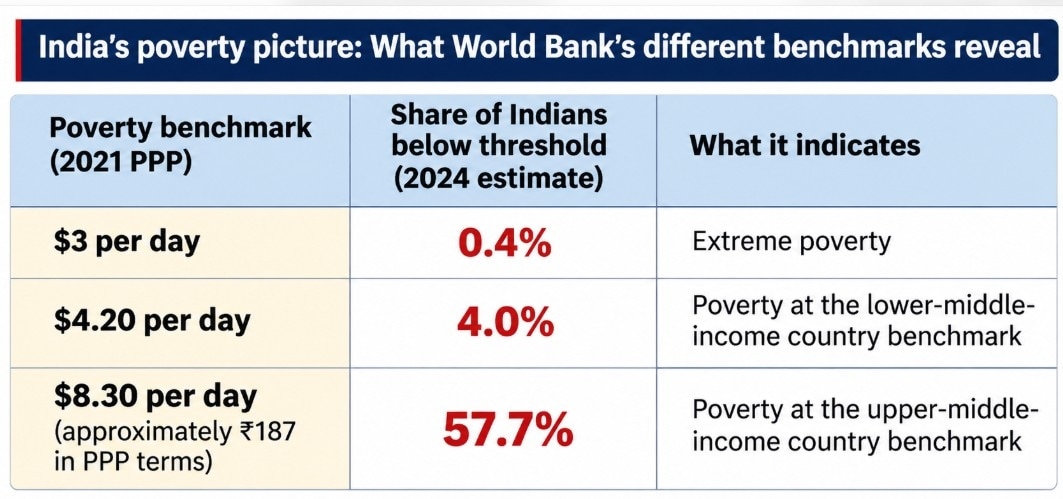



 Moving above the extreme poverty threshold does not necessarily mean a household has stable employment, adequate savings or sufficient protection against inflation and medical emergencies.
India has made significant progress in reducing extreme poverty, but a large proportion of its population remains economically vulnerable. While the share of Indians living in extreme poverty has declined sharply, World Bank estimates suggest that 57.7% of the population remained below a higher poverty benchmark of $8.30 per day in 2024.
A recent analysis shared by Markets by Zerodha has highlighted the contrasting picture emerging from India's poverty statistics, raising questions about how poverty is measured and whether escaping extreme deprivation necessarily translates into financial security.

 'Democrats sceptical of Trump's Pakistan tilt': US expert sees stronger India ties after midterms
 Anti-Indian rhetoric may have backfired on MAGA candidates in US elections, says Congressman
 BT Explainer: Intel is diverting chip-making capacity to meet AI demand. What does it mean for PC buyers?
 Why US midterm elections may not change the tariff equation for India
 Adani Ports to acquire Europe's second-largest liquid storage operator Evos, add 8 European terminals
 Crowded Markets, Empty Shopping Bags? Delhi Traders Feel The Diwali Pinch
 Is The Democratic Sweep A Double-Edged Sword For India’s Trade Deal?
 Trump, Tariffs & India-US Ties: What Changes After US Midterms? | Davinder Sandhu
 US Midterms: Will American Companies Increase Bets On India Now? | Vinay V. Singh
 #Podcast | #Episode 19 | Real State Of India's Economy: Dr. Shamika Ravi On Poverty, Jobs & Rupee

 Nasdaq plunges nearly 4%, enters correction territory as AI stocks crash after Democrats' US midterm victory
 Dhanteras 2026: Titan, Kalyan Jewellers, TBZ among jewellery stocks to watch
 Titan Company Q2 earnings: Net profit rises 54%, revenue at Rs 17,830 crore
 Bharti Airtel Q2 net profit rises 31% to Rs 8,888 crore; ARPU climbs to Rs 271
 Solar Industries: Management sees FY27 guidance beat; Goldman Sachs, Jefferies retain bullish stanceCrowded Markets, Empty Shopping Bags? Delhi Traders Feel The Diwali PinchIs The Democratic Sweep A Double-Edged Sword For India’s Trade Deal?Trump, Tariffs & India-US Ties: What Changes After US Midterms? | Davinder SandhuUS Midterms: Will American Companies Increase Bets On India Now? | Vinay V. Singh#Podcast | #Episode 19 | Real State Of India's Economy: Dr. Shamika Ravi On Poverty, Jobs & Rupee


