


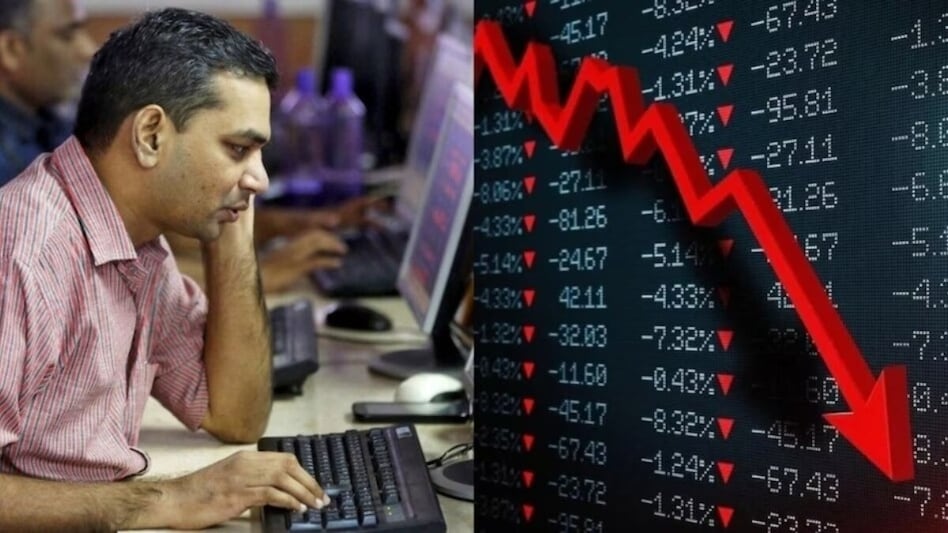
 Vedanta shares are trading lower than the 5 day, 10 day, 20 day, 30 day, 50 day, 100 day, 150 day and 200 day moving averages
Shares of Vedanta Ltd are in a short-term downtrend, falling in the last five sessions. The metal and mining major's stock is down 8% during the period. With the ongoing correction, Vedanta shares have turned oversold with a RSI of 26.8. A RSI below 30 indicates that a stock is oversold on charts.
Vedanta shares are trading lower than the 5 day, 10 day, 20 day, 30 day, 50 day, 100 day, 150 day and 200 day moving averages, indicating that the stock has been trading in the bearish zone.

 'FOMO, fixed return': SEBI proposes revamped ad code for bond portals from misleading investors
 Bangladesh-Pakistan ties: What Dhaka’s interest in Saudi-Türkiye defence pact means for India
 AI jobs rise 51% in India, but 75% of job skills could change by 2030: LinkedIn India head
 From small loans to big businesses : How rural women are changing India’s microfinance story
 RBI forex swap facility draws $72.85 billion inflows, FCNR(B) deposits account for bulk
  Rental Income Tax: 3 Key Deductions Every Senior Citizen and Property Owner Should Know
 Meta’s $200 Billion Trial: Did Instagram & Facebook Keep Kids Hooked?
 Motor Insurance Explained: Is Third-Party Car Insurance Enough? Know Before You Buy
 Retirement Tax Planning: 5 Ways Senior Citizens Can Reduce Their Tax Liability
 #IndiaAt100 : Adipen Bose Nandhiji On Conscious Capitalism- Can Profit & Purpose Coexist?
 'FOMO, fixed return': SEBI proposes revamped ad code for bond portals from misleading investors
 Crompton Greaves says no plan to sell stake, expects revenue to double by FY31
 Gaja Alternative Assets IPO: 3 ways to check application status; allotment odds, GMP, listing date
 FII sentiment shows early signs of turnaround after months of selling: Report
 ₹24,800 crore bill: How transaction costs are eating into retail derivatives trading'FOMO, fixed return': SEBI proposes revamped ad code for bond portals from misleading investors
 Numero Uno Gujarat: How Gujarat, the growth giant, is attracting massive investments in manufacturing
 Govt scraps 12-minute ad cap on TV channels to level playing field with digital media
 Gold ETFs attract ₹1,179 crore in first half of August even as prices rebound: What is driving investor demand?
 How We Did It: The methodology behind the ranking of India’s Top 10 manufacturing states












