


 Kerala’s per capita income rose from ₹2.09 lakh in FY20 to ₹3.08 lakh in FY25, while Tamil Nadu’s grew faster from ₹2.06 lakh to ₹3.62 lakh.
Ahead of the Assembly elections in two of South India’s economic powerhouses, Kerala and Tamil Nadu, the focus is increasingly turning to the economic performance of their respective chief ministers. Pinarayi Vijayan and M. K. Stalin play a significant role in the growth story of India. These states contribute strongly to services, manufacturing, exports and remittances.
As voters head towards elections, the economic record of the past five years under Pinarayi Vijayan in Kerala and M. K. Stalin in Tamil Nadu is likely to become an important part of the political debate.
Data from the Reserve Bank of India (RBI) provides a clear picture of how these economies have evolved over the past five years. From economic growth and per capita income to government spending and rising debt, the numbers tell a story of growing economies, infrastructure development, higher public investment and increasing fiscal pressures, setting the stage for a closely watched political and economic contest ahead of the elections.
Economic growth
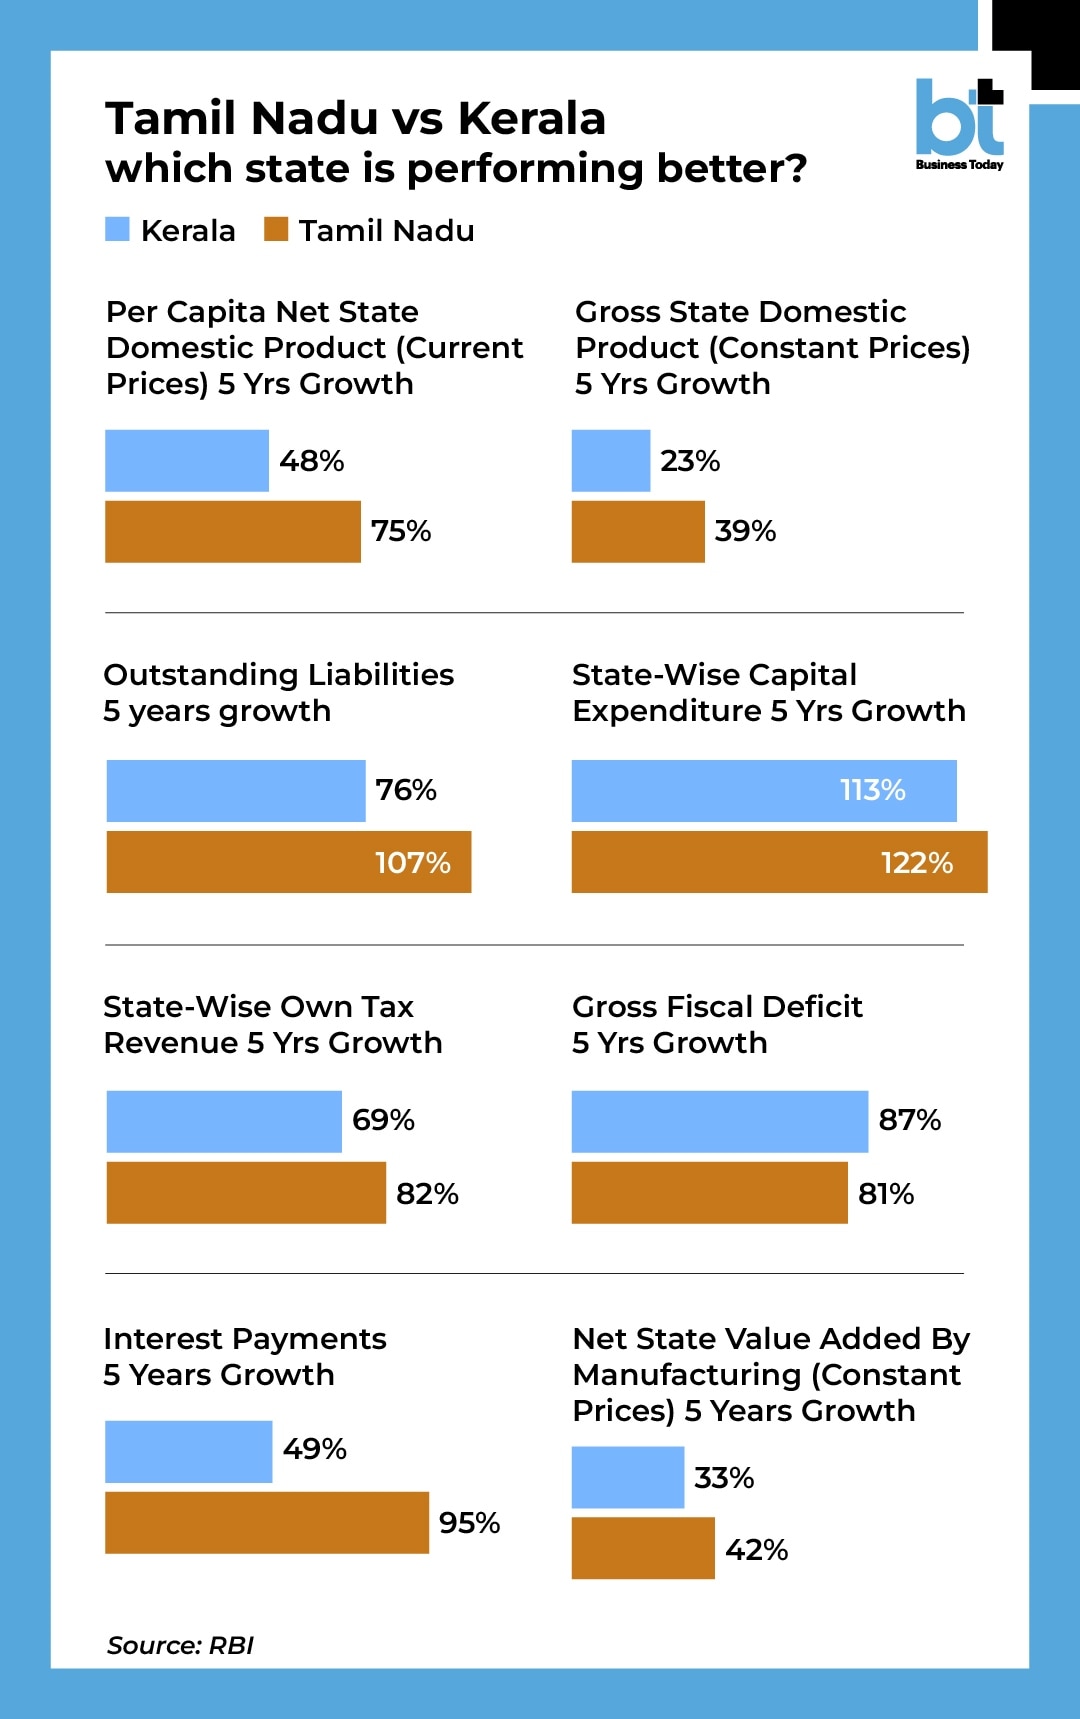
Both states have seen their economies expand, but Tamil Nadu has grown faster. Kerala’s Gross State Domestic Product (at constant prices) increased from Rs 5.6 lakh crore in 2019-20 to Rs 6.9 lakh crore in 2024-25, a growth of about 23%.
Tamil Nadu’s economy grew from Rs 12.4 lakh crore to Rs 17.3 lakh crore during the same period, showing a much stronger expansion of about 39%. This suggests that while Kerala has maintained steady growth, Tamil Nadu’s economy has picked up speed in recent years.
Tax collections
A similar trend is visible in tax revenue. Kerala’s own tax revenue rose from Rs 50,323 crore in 2019-20 to Rs 84,884 crore in 2024-25 (BE), an increase of around 69%.
Tamil Nadu recorded a bigger rise. Its tax revenue increased from Rs 1.07 lakh crore to Rs 1.95 lakh crore in the same period, a growth of about 82%. Higher tax collections often reflect stronger economic activity and better revenue mobilisation.
ALSO READ: What you need to know about Census 2027: Timeline, digital shift, how to self-enumerate and more
Per capita income
Income levels have also improved in both states. Kerala’s per capita income increased from Rs 2.09 lakh in FY20 to Rs 3.08 lakh in FY25, a growth of about 48%.
Tamil Nadu’s per capita income rose faster from Rs 2.06 lakh to Rs 3.62 lakh, showing a sharp increase of around 75%. This means the average income in Tamil Nadu has grown more rapidly during the period.
ALSO READ: India's rural land inequality: Top 10% control nearly half of all land
Government spending on infrastructure
Both governments have sharply increased capital expenditure, which includes spending on roads, infrastructure and development projects.
Kerala’s capital expenditure rose from Rs 18,451 crore in FY20 to Rs 39,359 crore in FY25, a jump of about 113%. Tamil Nadu also raised its capital spending significantly from Rs 47,506 crore to Rs 1,05,387 crore, an increase of about 122%.
Rising debt and fiscal pressure
However, higher spending has also come with rising debt. Kerala’s outstanding liabilities increased from Rs 2.68 lakh crore in 2020 to Rs 4.71 lakh crore in 2025, a rise of about 76%.
Tamil Nadu’s liabilities grew even faster from Rs 4.62 lakh crore to Rs 9.56 lakh crore, an increase of about 107%.
Fiscal deficit has also widened in both states. Kerala’s deficit rose from Rs 23,838 crore to Rs 44,529 crore between FY20 and FY25, while Tamil Nadu’s deficit increased from Rs 60,179 crore to Rs 1,08,690 crore during the same period.
ALSO READ: Battle for Bengal: Trouble brewing for Mamata in Murshidabad?
Interest burden
With rising debt comes higher interest payments. Kerala’s annual interest payments increased from Rs 19,215 crore in FY20 to Rs 28,694 crore in FY25, a growth of about 49%.
Tamil Nadu saw a sharper rise, with interest payments almost doubling from Rs 31,980 crore to Rs 62,456 crore.
Manufacturing growth
Manufacturing has also expanded in both states, though Tamil Nadu again shows stronger growth. Kerala’s net state value added by manufacturing or manufacturing output increased from Rs 51,965 crore to Rs 69,251 crore over five years, a growth of about 33%.
Tamil Nadu’s manufacturing sector grew from Rs 2,28,224 crore to Rs 3,23,008 crore, marking a rise of about 42%.
The political takeaway
The data shows that both states have expanded their economies, increased infrastructure spending and improved income levels over the past five years. But the numbers also indicate that Tamil Nadu’s economy has grown faster in several areas such as GSDP, per capita income, manufacturing and tax revenue. At the same time, both states are facing higher debt and fiscal pressure as spending has increased.

 Can China really take down 'Sudarshan Chakra'? PLA's latest bold claim against India's S-400
 Cancer is leaving more children without mothers; India among six hardest-hit countries, says WHO
 RAM shortage declines global PC shipments down to 4.9%, Apple gains market share
 India renews lobbying deal with Trump ally Jason Miller for Rs 17 crore
, which it describes as the first integrated cyber platform developed by a professional services firm.") As AI reshapes cyber threats, EY bets on IP-led cyber platforms over traditional consulting
As AI reshapes cyber threats, EY bets on IP-led cyber platforms over traditional consulting Dubai Real Estate Outlook 2026: Why Rizwan Sajan Says Prices Could Surge After September
 Delhi-NCR Monsoon Misery Returns: Why Does Every Spell Of Rain Bring The Same Crisis?
 Why SBI Mutual Fund Is Going Public: Top Executives Answer Key Investor Questions
 Sony INZONE H6 Air Gaming Headphones Unboxing
 ISOIN Wealth Discusses ICICI Prudential Multi-Asset Active FoF
 Sensex, Nifty trim gains but settle higher; what's next for the market?
 Adani Enterprises shares gain as group forays into low-carbon chemical production
  Kalyan Jewellers shares zoom 25% in two days; is more steam left?
 TCS Q1 results: Net profit rises to ₹13,349 crore, revenue up 14% | Quarterly earnings details
 TCS Q1 FY27 results: Rs 12 per share interim dividend announced; check record date