

 On the weekly chart, the index has formed a bearish candle and has closed at 4,4879.50 levels. This bearish candle is a break on the bullish momentumOn the weekly chart, the index has formed a bearish candle and has closed at 4,4879.50 levels. This bearish candle is a break on the bullish momentum
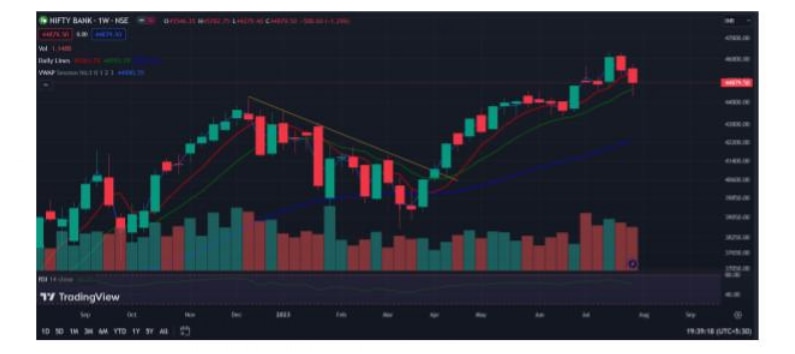
On the weekly chart, the BANKNIFTY have made a high of 4,5782.75 and closed the session at 4,4879.5 levels, down by 1.29 per cent lower than the previous week's close.
On the weekly chart, the index has formed a bearish candle and has closed at 4,4879.50 levels. This bearish candle is a break on the bullish momentum. The RSI momentum indicator is currently trading around 60 levels. The low of the bearish candle is around 4,4279.40 levels, indicating also a strong support for the index. The index has shown a sharp bounce from the support levels mentioned. If the index moves on the higher side, we expect HDFCBANK to outperform the BANKNIFTY index. Also, INDUSINDB BANK can be another front runner in private banking. While in PSU banks PNB and CANBK is expected to move higher and deliver a decent gain in the coming week.
The BANKNIFTY August futures are trading at a 121.70-point premium to the BANKNIFTY spot. Also index’s futures levels has been able to close above 4,5000 at 4,5001.60 levels.
The OI distribution for BANKNIFTY Put options shows that 4,4500 have the highest concentration, which may act as support for the current expiry. BANKNIFTY Call strikes 4,5500 and 4,6000 saw significant OI concentrations and may act as resistance for the current expiry.
On weekly charts we can witness a smaller resistance at 45650 levels. If BANKNIFTY sustains above the mentioned levels, it can move higher towards the all-time high levels of 46310 and above.
Strong support is located around 44590 levels which is also 50 Day EMA levels, if the Index closes below the mentioned support, momentum will shift to downside.
Support: 44300-44590
Resistance: 45650-45900
Bias- Sideways to Bullish
Views are personal. The author is Executive Director, Choice Broking
 ‘Absolutely no compromise on agriculture, dairy, sugar’: Piyush Goyal on India-US trade deal
 operations") Exclusive: Adani Group to start coal gasification work this year, expand MRO operations, says Jeet Adani
Exclusive: Adani Group to start coal gasification work this year, expand MRO operations, says Jeet Adani Kalyan Jewellers, Vaibhav Global, Thangamayil, Senco, PN Gadgil & Goldiam jump up to 15%; here's why
 Shipping Corp shares zoom 14% on Q3 earnings, dividend; check details
  Elon Musk shifts SpaceX focus to ‘self-growing’ Moon city over Mars colony
 India-U.S. Trade Deal Triggers Political Storm As Congress Says Trump Wins, Modi Loses On Farmers
 US Map On Trade Deal Shows Full J&K As India, Sending Sharp Signal To Pakistan And China
 “India’s Trade Policy Has Shifted Fundamentally After The US Deal,” Says Piyush Goyal
 Govt Scraps Small Car Concessions In Emission Norms; Maruti Seen Most Impacted
 Bhaijaan Meets Bhagwat: Salman’s RSS Appearance Triggers Political FirestormKalyan Jewellers, Vaibhav Global, Thangamayil, Senco, PN Gadgil & Goldiam jump up to 15%; here's whyShipping Corp shares zoom 14% on Q3 earnings, dividend; check details
  YES Bank shares snap two-day fall; analysts advise caution on near-term outlook
 Tata Steel shares hit record high on Q3 earnings; here's what brokerages say
  Suzlon Energy price target cut by 33%, order inflows at risk; here's why