

 Amazon app introduces 'Price History' feature. (Photo: Unsplash)
 Amazon app introduces 'Price History' feature. (Photo: Unsplash)
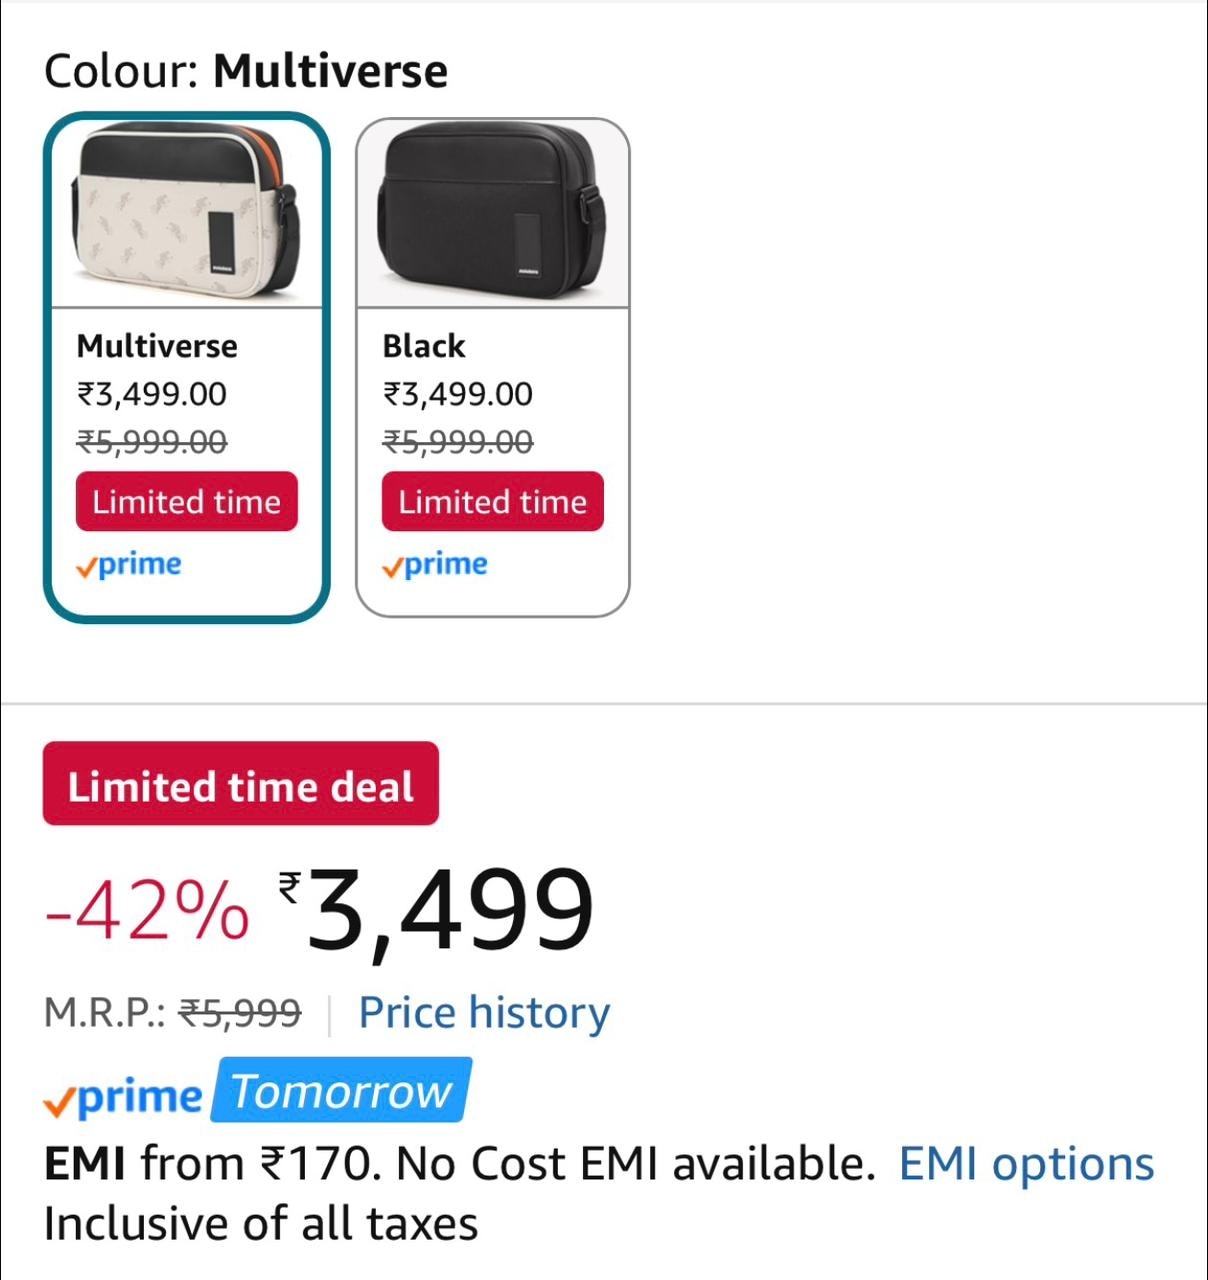
Online shoppers in India often rely on flash sales and festive discounts to grab the best deals. To help customers navigate the pricing volatility, Amazon India has quietly introduced a new, integrated ‘Price History’ feature directly within its shopping app. This tool allows buyers to verify the true value of any discount and determine whether the current rate is genuinely low or simply an average selling price. The move brings powerful price tracking right into the official mobile platform, eliminating the need for separate browser tools and elaborate extensions that we so-love to use.
This functionality seems to be exclusive to the Amazon mobile application for now and has not been rolled out to the desktop website at the time of writing.
Within the app, users can navigate to a product page to find the “Price History” option right underneath the price, which opens the price history graph within Amazon's Rufus AI's tab. The graph displays the product’s price changes over selectable periods of 30 or 90 days, providing a clear historical record and allowing buyers to see price highs and lows leading up to, for example, the Great Indian Festival or Diwali sales and even beyond.
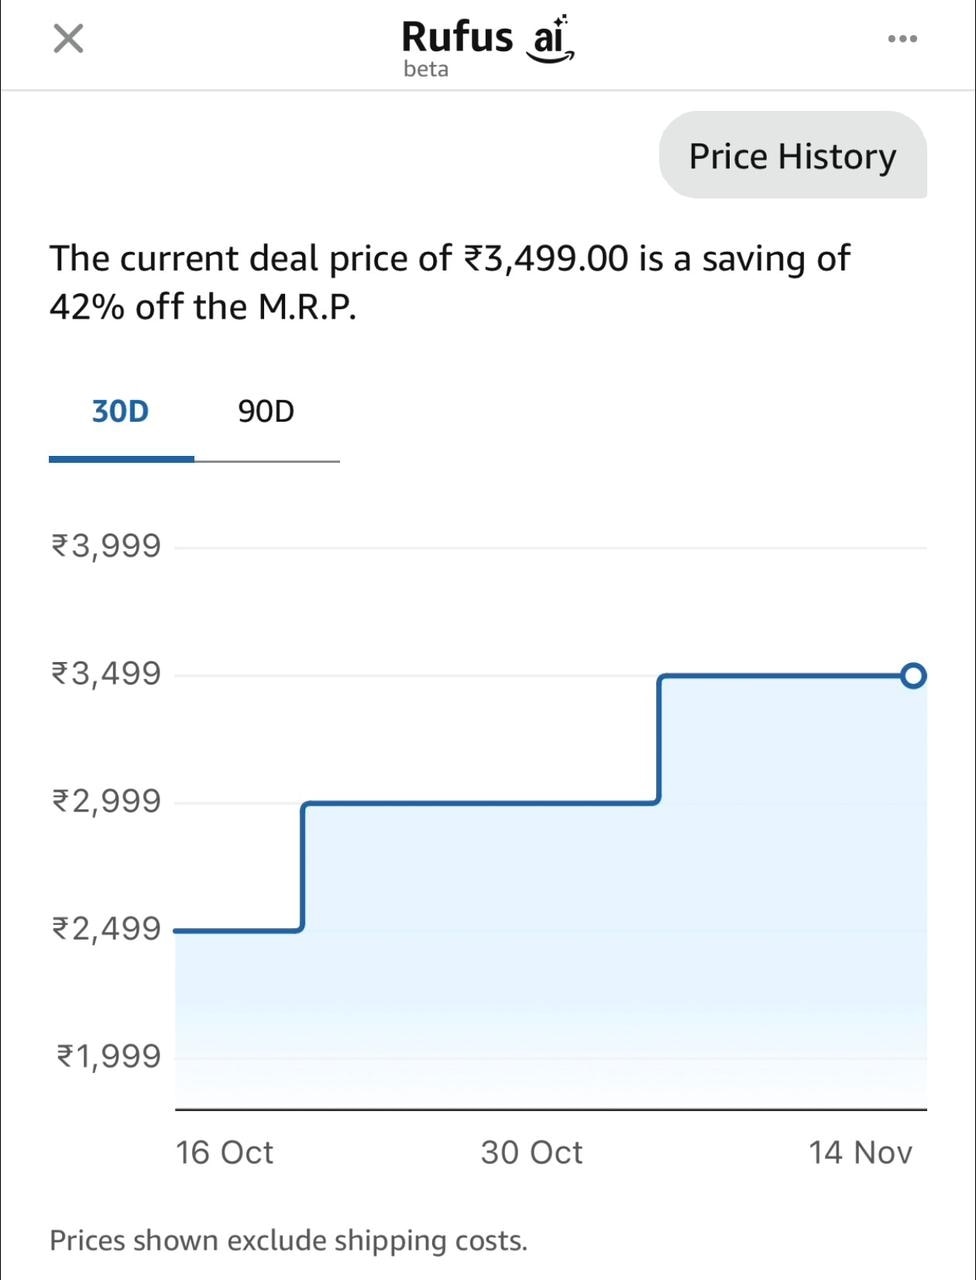
This new layer of price transparency is a valuable addition for consumers. By analysing the 90-day trend, customers can make smart, data-driven decisions, ensuring they are saving precious rupees and getting optimal value for their spend. Gone are the days of artificially inflated original price, struck through with a “discount” tag, being sold at regular price yet being labelled "discount price”...at least on the Amazon app.
(Note: The prices shown in the graph exclude any shipping costs that may apply.)
For Unparalleled coverage of India's Businesses and Economy – Subscribe to Business Today Magazine
 PM Modi reveals he had a semiconductor plan 20 years ago. Why it never took off
 'Adani case should never have been brought': US Justice Department urges judge to permanently drop charges
 Sterlite Tech, Olectra Greentech, Kaynes Tech shares: Buy, hold or sell? Trading strategy
 facility in Sanand on Saturday") Sanand's big chip moment: 'Made in India' semiconductors to be exported to Japan, US, Europe
Sanand's big chip moment: 'Made in India' semiconductors to be exported to Japan, US, Europe Mumbai monsoon: 6 natural forces & 3 urban factors which turns the city into a 'bathtub'
 Lower PF Contribution Ceiling Explained: Will Higher Take-Home Salary Increase Your Tax?
 FMCG Stocks Vs Consumption Plays: Where Should Investors Put Their Money Now? Devang Explained
 Delhi EV Policy Under Scanner: India Today Finds Defunct Charging Stations Across City
 NPS Regular Income Scheme: Regular Income Plus Wealth Creation? Here's How It Works
 Visa Payment Passkeys Launched In India: Will Biometrics Replace OTPs?Sterlite Tech, Olectra Greentech, Kaynes Tech shares: Buy, hold or sell? Trading strategy
 HCLTech, Mphasis, Persistent, Tech Mahindra, Zensar Tech: Brokerage revises ratings, share price targets
 Midcap, smallcap stocks offer fresh value as earnings support revival, says Devang Mehta
 TCS, Infosys, Wipro, HCL Tech: Top-5 IT stocks' m-cap slips to RIL as AI disruption bites
 Tata Power, Adani Power: Short-term trading strategy for these power stocks