
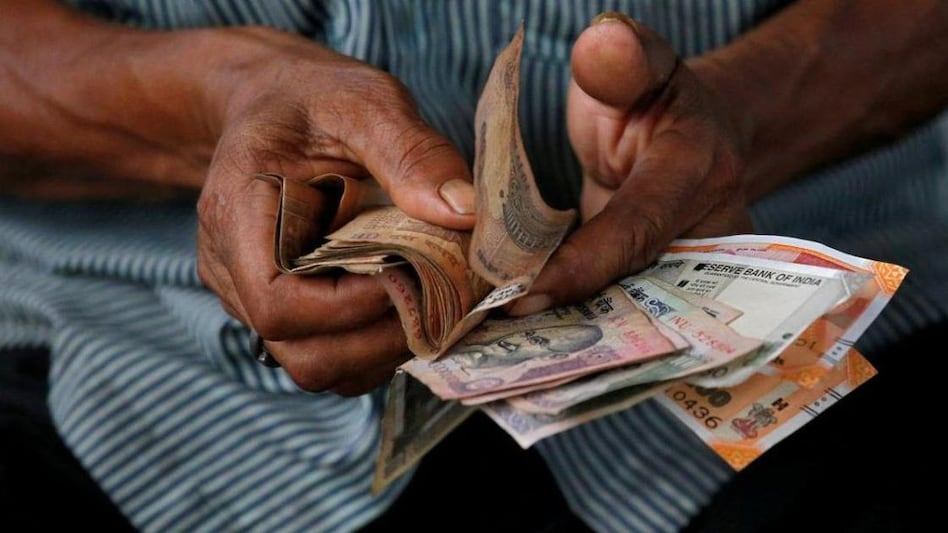
 Income 2024: Here's how much lower middle-class individuals are earning and spending now (Representative image)
A recent study has stated that the personal monthly income of lower-middle-class individuals is around Rs 33,000, while the monthly expenses are around Rs 19,000 at present. The study by Home Credit India (HCIN), Great Indian Wallet, was conducted across 17 cities including Delhi-NCR, Mumbai, Kolkata, Chennai, Bengaluru, Hyderabad, Ahmedabad, Pune, Lucknow, Jaipur, Bhopal, Patna, Ranchi, Chandigarh, Dehradun, Ludhiana and Kochi. The sample size was approx. 2500 in the age group of 18-55 years, with an annual income between Rs 2 lakh to Rs 5 lakh.
Hyderabad has the highest personal monthly income of Rs 44,000. It further shows that the average of personal monthly income in 2024 stands at Rs 35,000 for metros and Rs 32,000 for Tier 1 and 2 cities, showing an increase from Rs 33,000 (metros), Rs 30,000 (Tier 1), and Rs 27,000 (Tier 2) in 2023.

 AI revenue is surging at Indian IT firms, but how much is adding to growth?
 Festive spending in urban India to drop 6% to ₹1.97 lakh crore amid inflation: Survey
 India to overtake Japan as world’s fourth-largest economy in 2027: IMF projections
 BT Explainer: What the SC verdict on Yes Bank’s AT-1 bonds means for the lender and will it alter AT1 bonds as such?
 Stock market: India back on investors’ radar as they warm to ‘non-AI stories’, says HSBC
 Jio IPO: Mukesh Ambani's Big ₹30,213 Crore Bet, Reliance Employees Asked To Invest?
 Flying Cars Are Here? Elon Musk Shows Tesla Roadster Flying Through Air In Stunning Demo
 Ramakrishna P, CEO, India Mobile Congress Talks To Us About India’s Next Digital Frontier
 Market Recovery: Gaurang Shah Picks Banking, Defence, Power And Cement Stocks For Fresh Bets
 Will IDBI Employees Lose Jobs? DIPAM Secretary Arunish Chawla Clears The Air On Pension & Benefit

 CCL Products shares fall 9% on Q2 results; brokerages see up to 30% upside
 PNB Q2 earnings: Net profit rises 13%, asset quality improves
 BT Explainer: What changes for investors post revision of new Closing Auction System
 PC Jeweller shares hit 52-week high; stock jumps 75% YTD; what analysts say
 Federal Bank Q2 earnings: Net profit at record high, asset quality improves
 India’s 10-year bond yield may rise to 7.6% as US Treasury yields remain elevated: SBI Research
 Saif Ali Khan rents out two commercial units in Mumbai for ₹22.76 lakh per month
 How Mukesh Ambani Is Tapping Reliance’s 4.2 Lakh Workforce To Boost Jio's Record IPO
 Jailer 2 Box Office: Rajinikanth Scores ₹125 Crore Opening, But Coolie Still Rules
 Should India Reconsider LTCG Tax? NITI Aayog VC Ashok Lahiri Responds