

 While 43% of PPFAS Flexi Cap's portfolio overlaps with HDFC Flexi Cap, the two schemes follow distinct investment styles, offering investors exposure to different approaches within the flexi cap category.While 43% of PPFAS Flexi Cap's portfolio overlaps with HDFC Flexi Cap, the two schemes follow distinct investment styles, offering investors exposure to different approaches within the flexi cap category.
India's two largest flexi-cap funds — HDFC Flexi Cap Fund and Parag Parikh Flexi Cap Fund (PPFAS)—may share several marquee stocks, but their portfolios and investment approaches remain meaningfully different, according to the latest portfolio data for April 2026.
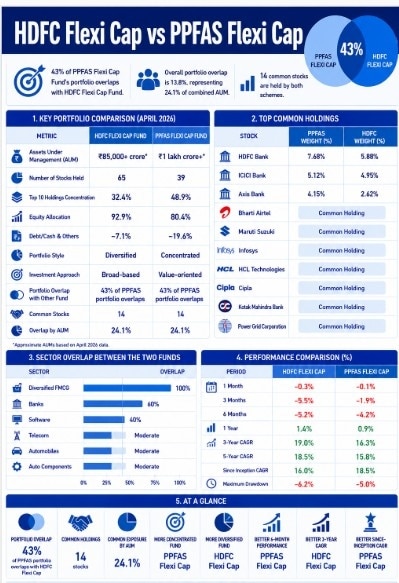
Around 43% of the PPFAS Flexi Cap Fund's portfolio overlaps with the HDFC Flexi Cap Fund, meaning nearly half of PPFAS' assets are invested in stocks that are also held by the HDFC Flexi Cap. However, the remaining allocation is spread across unique stocks, debt instruments, cash, and REITs, highlighting the contrasting styles adopted by the two fund houses.
AUM overlap
While the overlap appears substantial from PPFAS' perspective, the common exposure between the two schemes is relatively limited when measured by assets under management (AUM).
Data shows that the two funds have a portfolio overlap of 13.8%, representing 24.1% of combined AUM, with just 14 common stocks shared between the portfolios.
This indicates that despite investing in several of the same blue-chip names, both schemes retain distinct characteristics and stock-selection frameworks.
Banking stocks
Financial stocks account for a large part of the common portfolio.
Among the top shared holdings are:
Stock PPFAS Allocation HDFC Allocation
HDFC Bank 7.68% 5.88%
ICICI Bank 5.12% 4.95%
Axis Bank 4.15% 2.62%
Other stocks common to both portfolios include Bharti Airtel, Maruti Suzuki, Cipla, Infosys, HCL Technologies, Kotak Mahindra Bank and Power Grid Corporation.
The common holdings suggest that both fund managers continue to favour high-quality businesses with strong earnings visibility.
Industry exposure
Sectoral overlap is highest in Diversified FMCG, where exposure overlaps completely, followed by banks at 60% and software companies at 40%.
Telecom, automobiles and auto components also feature among common sectors, though overlap levels are lower.
This suggests that while the funds may differ in stock selection, they share similar preferences for certain sectors of the economy.
Six-month performance
Recent market volatility has weighed on both schemes, though Parag Parikh Flexi Cap Fund has delivered slightly better returns over the past six months.
The fund posted a six-month return of -4.2%, compared with -5.2% for HDFC Flexi Cap Fund.
Over longer periods, however, the picture changes. HDFC Flexi Cap has generated a three-year CAGR of 19%, compared with 16.3% for PPFAS. On a five-year basis, HDFC Flexi Cap has delivered annualized returns of 18.5%, ahead of PPFAS' 15.8%.
PPFAS, however, maintains an edge since inception, having generated an 18.5% CAGR, compared with 16% for HDFC Flexi Cap.
MUST READ: PGIM India MF revises subscription limits for overseas fund schemes; new SIP cap set at ₹50,000
Different approaches
One of the biggest differences between the two funds lies in portfolio concentration.
PPFAS Flexi Cap follows a concentrated strategy, with nearly 48.9% of assets invested in its top 10 holdings.
By comparison, HDFC Flexi Cap allocates 32.4% to its top 10 stocks, reflecting a more diversified approach.
Portfolio data shows that HDFC Flexi Cap holds around 65 stocks, whereas PPFAS owns 39 stocks, underscoring the contrast between breadth and concentration.
Asset allocation
The two funds also differ in asset allocation.
HDFC Flexi Cap maintains a higher equity exposure of about 92.9%, with around 5% allocated to debt. In contrast, PPFAS Flexi Cap has 80.4% invested in equities, while maintaining higher allocations to debt, cash and REITs.
For investors considering both schemes, the data suggest that despite a 43% overlap, the portfolios remain sufficiently differentiated to offer exposure to distinct investment philosophies and portfolio construction styles.
MUST READ: Why HDFC Mutual Fund has restricted fresh lump-sum investments in gold schemes
 Sensex, Nifty take winning run to fourth session; investor wealth swells by over Rs 8.2 lakh crore
 How is Gujarat’s Morbi ceramic cluster driving India’s LNG demand?
 Fuel price pain accelerates EV penetration to record 13% in June
 Solar panel failed to cut power bills: Consumer court orders firm to pay ₹25,265 as compensation
 2.5 hrs for 31 km! Infy co-founder Kris Gopalakrishnan calls out Bengaluru's traffic nightmare
 India Vs Global Markets: Devina Mehra Explains Rupee Risk, PMS Strategy And Diversification
 Indian Stock Market Bottom? Devina Mehra Reveals Why Downside May Be Limited
 India Stock Market Outlook: Top Sectors For The Next 18-24 Months
 LIVE Daily Calls: Ask Your STOCK MARKET TODAY QUERIES | Market Update LIVE | Share Market News Today
 Indian Rupee Outlook: NRI Inflows Bring Relief But Bigger Risks Remain
 Realty stock climbs after record quarterly pre-sales; check target price, outlookSensex, Nifty take winning run to fourth session; investor wealth swells by over Rs 8.2 lakh crore
 TCS Q1 results, dividend announcement: Key dates, earnings preview, 5 things to watch
 IT stocks to buy: TCS, Infy, TechM, HCL Tech, Persistent, Netweb, KPIT; Check target price
 Ola Electric shares extend fall, tumble over 6%; here's what's weighing on the stock