

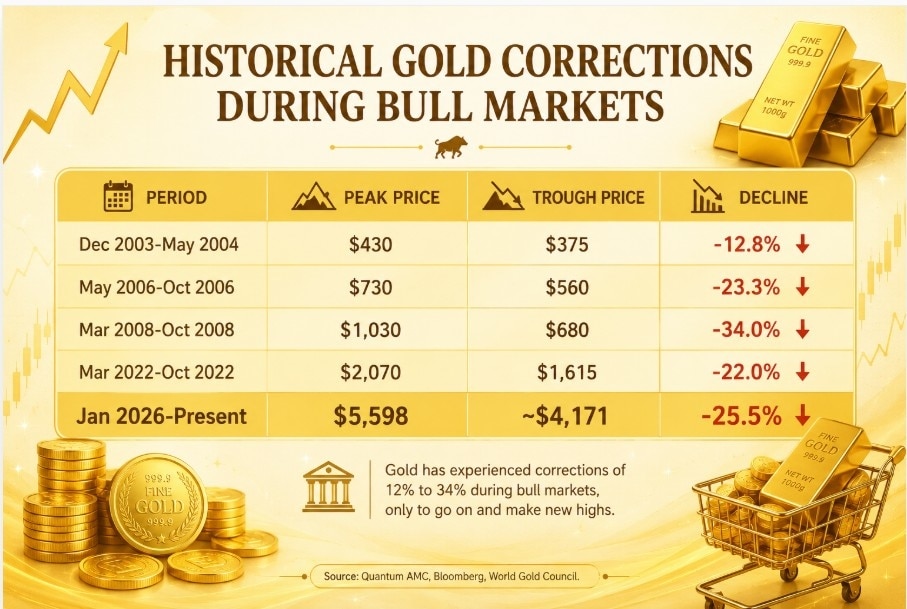

 Gold has fallen around 25.5% from its all-time high of $5,598 an ounce reached in January and recently slipped to around $4,171 an ounce.
Gold prices have corrected sharply from their January 2026 record highs, leaving many investors wondering whether the rally has finally run out of steam or whether the recent decline presents a fresh opportunity to accumulate the precious metal.
According to Chirag Mehta, Chief Investment Officer at Quantum AMC, the current selloff should be viewed as a temporary correction rather than the end of gold's long-term bull market.
Gold has fallen around 25.5% from its all-time high of $5,598 an ounce reached in January and recently slipped to around $4,171 an ounce. In India, MCX gold futures dropped to about ₹1,49,500 per 10 grams, their lowest level since early May.
The correction has been triggered by stronger-than-expected US economic data, rising bond yields, expectations of higher interest rates and the impact of the ongoing conflict in the Middle East.
However, Mehta believes investors should focus less on recent price action and more on the structural factors that powered gold's historic rally from $2,000 to nearly $5,600 an ounce.
MUST READ: Gold ETFs see record ₹725 cr outflow in May, first in 2026; Silver ETFs attract ₹2,133 cr
"The more consequential question for investors is not what has moved in the past two weeks, but what has not moved at all," Mehta said.
He noted that rising US debt levels, persistent inflation, concerns over fiscal deficits and continued diversification by central banks away from US Treasuries remain intact and continue to support the long-term case for gold.
"Price corrections of the kind currently unfolding are not aberrations within a structural bull market; they are features of it," Mehta said.
What history shows
Quantum AMC's analysis highlights that corrections of 25-35% have historically occurred within major gold bull markets and have often been followed by fresh highs.
During the 2008 financial crisis, for example, gold prices plunged 33% as investors liquidated assets to raise cash. But the metal subsequently recovered and rallied 178% over the following three years, eventually touching record highs in 2011.
Similarly, gold witnessed a 27% correction between January and March 2026 before rebounding strongly.
"The current correction appears less like a structural breakdown and more like a normal and necessary consolidation within an ongoing secular bull market," Mehta said.
MUST READ: Equity mutual fund inflows fall to 1-year low in May; SIP contributions stay above ₹30,900 crore
Is this a buying opportunity?
According to Mehta, the current weakness could offer long-term investors an opportunity to build exposure to the yellow metal.
"The current level of $4,098-$4,200 has twice served as a meaningful accumulation zone in 2026 alone," he said.
Central bank demand also remains strong. Global central banks purchased a net 244 tonnes of gold during the first quarter of 2026, while the People's Bank of China extended its buying streak to 19 consecutive months by adding nearly 10 tonnes in May.
Mehta believes the forces underpinning gold's long-term outlook have not diminished.
"Rising sovereign debt supply, structurally elevated inflation and central bank diversification away from US Treasuries continue to support gold," he said.
For investors worried by the recent decline, Mehta argues that history offers an important lesson.
"For long-term investors, corrections of this nature have historically represented meaningful opportunities to build or add to positions at levels that, in retrospect, marked the lower bound of a broader bull market. The thesis has not broken; the price has simply offered a better entry point," he said.
MUST READ: India-UAE trade deal: Gold imports under preferential quota route remain virtually closed
FAQs
Why have gold prices fallen sharply from their January 2026 highs?
Gold prices have corrected due to stronger-than-expected US economic data, rising bond yields, expectations of higher interest rates, and the impact of the ongoing Middle East conflict. These factors have pressured gold in the short term.
Does the recent fall in gold prices mean the long-term rally is over?
According to Quantum AMC CIO Chirag Mehta, the current decline looks like a temporary correction rather than the end of gold’s long-term bull market. He says the structural drivers supporting gold are still in place.
What long-term factors continue to support gold prices?
Key long-term supports include rising US debt, persistent inflation, fiscal deficit concerns, and central banks diversifying away from US Treasuries. Strong central bank buying of gold also adds support to the broader outlook.
What does history suggest about sharp corrections in gold bull markets?
History shows that 25 to 35 percent corrections are common during major gold bull markets. Quantum AMC noted that after a 33 percent fall during the 2008 financial crisis, gold later rallied strongly and reached fresh record highs.
Is the current correction a good buying opportunity for gold investors?
Mehta believes the present weakness may offer long-term investors a good chance to accumulate gold. He highlighted the $4,098 to $4,200 range as an important accumulation zone, suggesting the fall may provide a better entry point rather than signal a broken investment thesis.

 Cancer is leaving more children without mothers; India among six hardest-hit countries, says WHO
 RAM shortage declines global PC shipments down to 4.9%, Apple gains market share
 India renews lobbying deal with Trump ally Jason Miller for Rs 17 crore
, which it describes as the first integrated cyber platform developed by a professional services firm.") As AI reshapes cyber threats, EY bets on IP-led cyber platforms over traditional consulting
As AI reshapes cyber threats, EY bets on IP-led cyber platforms over traditional consulting Meta's US data centre triggers rare bacteria scare: How dangerous is Cupriavidus gilardii?
 Dubai Real Estate Outlook 2026: Why Rizwan Sajan Says Prices Could Surge After September
 Delhi-NCR Monsoon Misery Returns: Why Does Every Spell Of Rain Bring The Same Crisis?
 Why SBI Mutual Fund Is Going Public: Top Executives Answer Key Investor Questions
 Sony INZONE H6 Air Gaming Headphones Unboxing
 ISOIN Wealth Discusses ICICI Prudential Multi-Asset Active FoF
 Sensex, Nifty trim gains but settle higher; what's next for the market?
 Adani Enterprises shares gain as group forays into low-carbon chemical production
  Kalyan Jewellers shares zoom 25% in two days; is more steam left?
 TCS Q1 results: Net profit rises to ₹13,349 crore, revenue up 14% | Quarterly earnings details
 TCS Q1 FY27 results: Rs 12 per share interim dividend announced; check record date